


The Federal Reserve’s interest rate cut decision on Wednesday was like receiving a gift from a wish list. When the rate cut was announced, the market initially rose, acting surprised by the decision. But the excitement fizzled off as the market closed lower on that day. The next day, buyers were back, but Friday’s action had more selling than buying. You have to cut it some slack, though, given it was triple witching Friday—the expiration of stock options, index options, and index futures. It’s not unusual to see elevated trading activity as traders work on unloading positions or rolling them out to a future date.
In spite of the stock market’s up and down movement, the broader market indexes didn’t take too much of a hit. The S&P 500 ($SPX) and Nasdaq Composite ($COMPQ) closed just a hair lower, while the Dow Jones Industrial Average ($INDU) closed slightly higher, notching an all-time record close.
Let’s unpack the charts of the broader indexes, starting with the S&P 500.
S&P 500 Breaks Above Resistance
The large-cap S&P 500 index broke above the resistance of its slightly downward-sloping trendline. The daily chart below shows that market breadth in equities is improving. Note that three market breadth indicators are displayed in the lower panels below the price chart.

CHART 1. DAILY CHART OF THE S&P 500. The large-cap index still has momentum with market breadth indicators confirming bullish strength.Chart source: StockCharts.com. For educational purposes.
The S&P 500 Bullish Percent Index ($BPSPX) is at 77, the NYSE Advance-Decline Line is rising, and the percent of S&P 500 stocks trading above their 200-day moving average is at 76.60. All three indicators confirm bullish momentum in the S&P 500.
The Nasdaq Composite
The Tech-heavy Nasdaq ($COMPQ) has also broken above the resistance of its downtrend line, but, unlike the S&P 500, it didn’t close at a new all-time high this week. Its market breadth isn’t as strong as that of the S&P 500, as is visible in the market breadth indicators in the lower panels.

CHART 2. DAILY CHART OF NASDAQ COMPOSITE. The Nasdaq is trading around its August high. If it breaks above that level and market breadth continues to expand, it would confirm a bullish move.Chart source: StockCharts.com. For educational purposes.
The BPI for the Nasdaq is at 54.85, which is slightly bullish. The percentage of Nasdaq stocks that are trading above their 200-day moving average is at 44.23, while the Nasdaq Advance-Decline Line is rising. So overall market breadth for the Nasdaq doesn’t confirm an uptrend as strongly as one in the S&P 500.
The Nasdaq Composite is trading close to its August high. A break above this would confirm a bullish move, so it’s worth adding this chart to your ChartLists.
The Dow Jones Industrial Average
The granddaddy of the indexes has been marching higher closing at a new all-time high (see chart below). After pulling back in early September, the Dow has taken the lead.

CHART 3. DAILY CHART OF DOW JONES INDUSTRIAL AVERAGE. The index closed at a record high and market breadth indicators point to strong bullish pressure.Chart source: StockCharts.com. For educational purposes.
The DJIA BPI is above 80 and trending higher, the percentage of Dow stocks trading above their 200-day moving average is relatively flat, and the Dow Advance-Decline line continues to rise higher. All three breadth indicators confirm the Dow is bullish.
The takeaway: The three broad indexes are up for the month. There’s a week and a day remaining this month. Will this September buck the seasonality trend?
Bonds, Gold, Oil
Bond prices have fallen since the Fed’s decision, possibly because the stock market is still coming to grips with the news. The chart of the iShares 20+ Year Treasury Bond (TLT) below shows that TLT is close to a support level.

CHART 4. BOND PRICES FALL BUT COULD FIND STABILITY SOON. Watch bond prices at the nearest support level.Chart source: StockCharts.com. For educational purposes.
If it stabilizes at this level and turns higher, it could present an opportunity to allocate a portion of your portfolio to bonds.
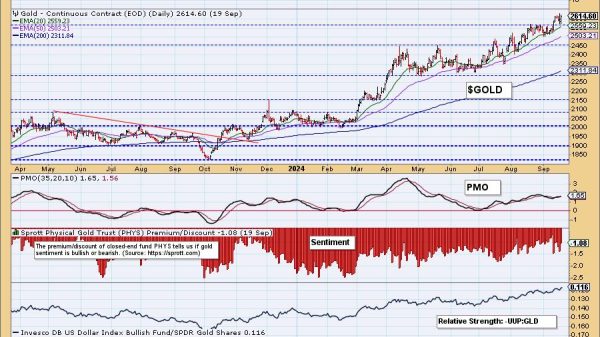
Meanwhile, commodities are showing upside price movement. Gold prices continue to rise, closing at an all-time high on Friday. Oil prices are off their lows, although they are still in a downtrend. The Energy Select Sector SPDR Fund (XLE) is at its 200-day moving average. Let’s see if it breaks above it next week. Energy was the leading sector for the week. And don’t ignore Utilities; the sector was the leading sector on Friday and could be poised for more upside movement.
In the Tech Front…
The week ended on interesting news. Talks of a Qualcomm (QCOM) takeover of Intel (INTC) surfaced on Friday. Shares of INTC traded higher on the news. This could impact chip stocks, which have had a rough ride of late. Another chip company we’ll hear about next week is Micron Technology (MU), which reports earnings next week. The rumor is that there may be some negative news. Micron has taken a beating since June, and technically, the chart looks ugly.
End of Week Wrap Up
- S&P 500 closed up 1.36% for the week, at 5702.55, Dow Jones Industrial Average up 1.62% for the week at 31,063.36; Nasdaq Composite closed up 1.49% for the week at 17948.32
- $VIX down 2.48% for the week closing at 16.15
- Best performing sector for the week: Energy
- Worst performing sector for the week: Real Estate
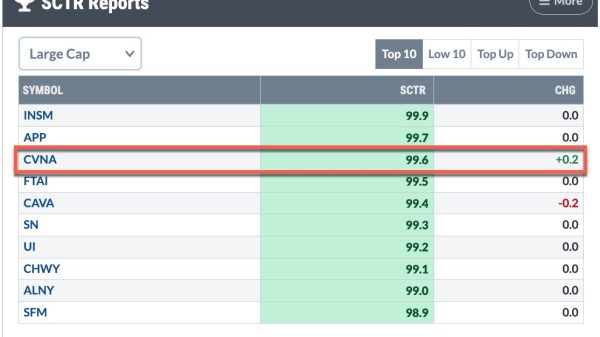
- Top 5 Large Cap SCTR stocks: Insmed Inc. (INSM); Carvana (CVNA); Applovin Corp (APP); Cava Group (CAVA); FTAI Aviation Ltd. (FTAI)
On the Radar Next Week
- August New Home Sales
- Q2 GDP Growth Rate
- August Durable Goods Orders
- Speeches from Chairman Powell and other Fed officials
- August Personal Consumption Expenditure (PCE)
- Micron (MU) Earnings
Disclaimer: This blog is for educational purposes only and should not be construed as financial advice. The ideas and strategies should never be used without first assessing your own personal and financial situation, or without consulting a financial professional.