


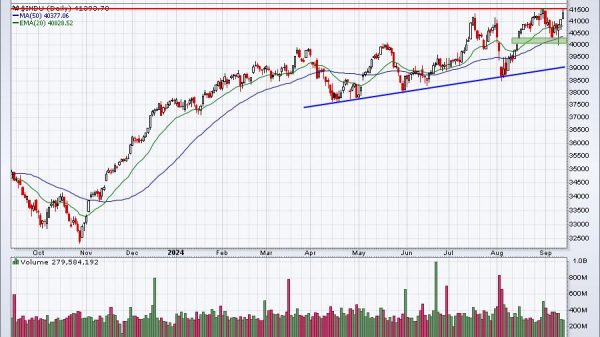


It’s a quiet end to August, with the broader stock market indexes wavering higher and lower. The Market Overview panel on the StockCharts Dashboard shows equity indexes closing higher. And yes, the Dow Jones Industrial Average ($INDU) closed at a record high.
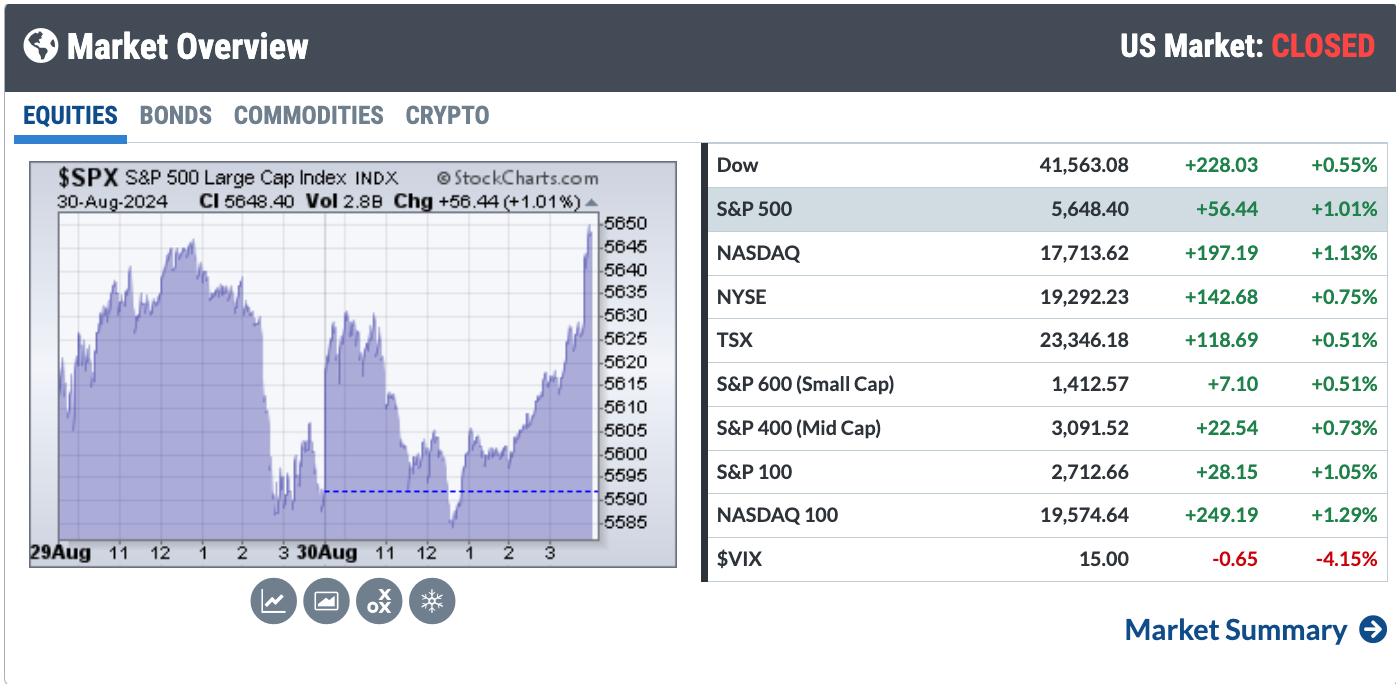
 FIGURE 1. MARKET OVERVIEW PANEL IN THE STOCKCHARTS DASHBOARD. All broader indexes were up on Friday.Image source: StockCharts.com. For educational purposes.
Stock Market Outlook
With August behind us, we now prepare for one of the worst months in the stock market. PCE data came out today, and it was pretty much in line with estimates. This means an interest rate cut in the next FOMC meeting is pretty likely. The Fed’s next meeting isn’t until September 18, and, given historical seasonality patterns, don’t expect too much upside in the first half of the month.
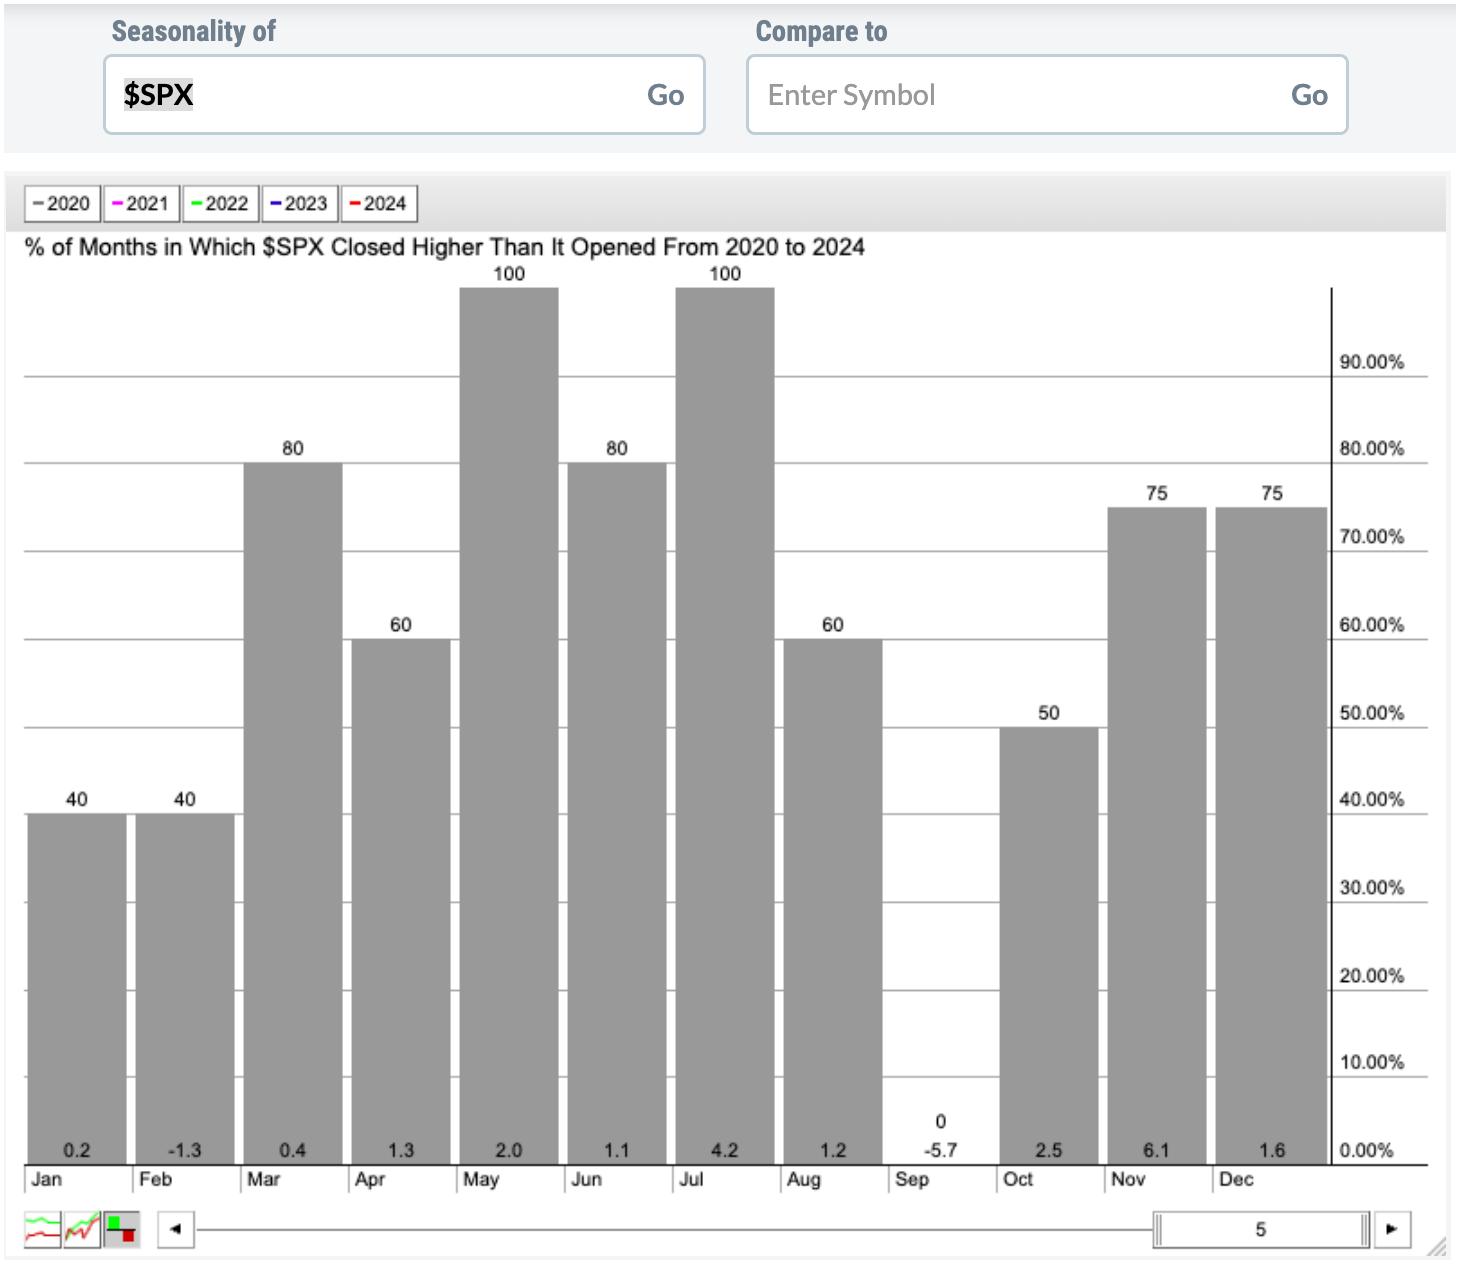
FIGURE 2. SEASONALITY CHART OF THE S&P 500 INDEX ($SPX). September is usually a weak month for large-cap stocks. Image source: StockCharts.com. For educational purposes.
The seasonality chart for the S&P 500 shows that August typically sees a 1% rise in the index. In 2024, the index’s performance was slightly higher, with a 2.28% rise. September looks dismal, but this is an election year, so things may turn out differently.
The S&P 500 has recovered from its August pullback, breaking a downtrend line (see chart below). Since then, the index has been trading sideways, refusing to reach its July 16 all-time high. Yet it’s trading above its 21-day exponential moving average, which is trending up.
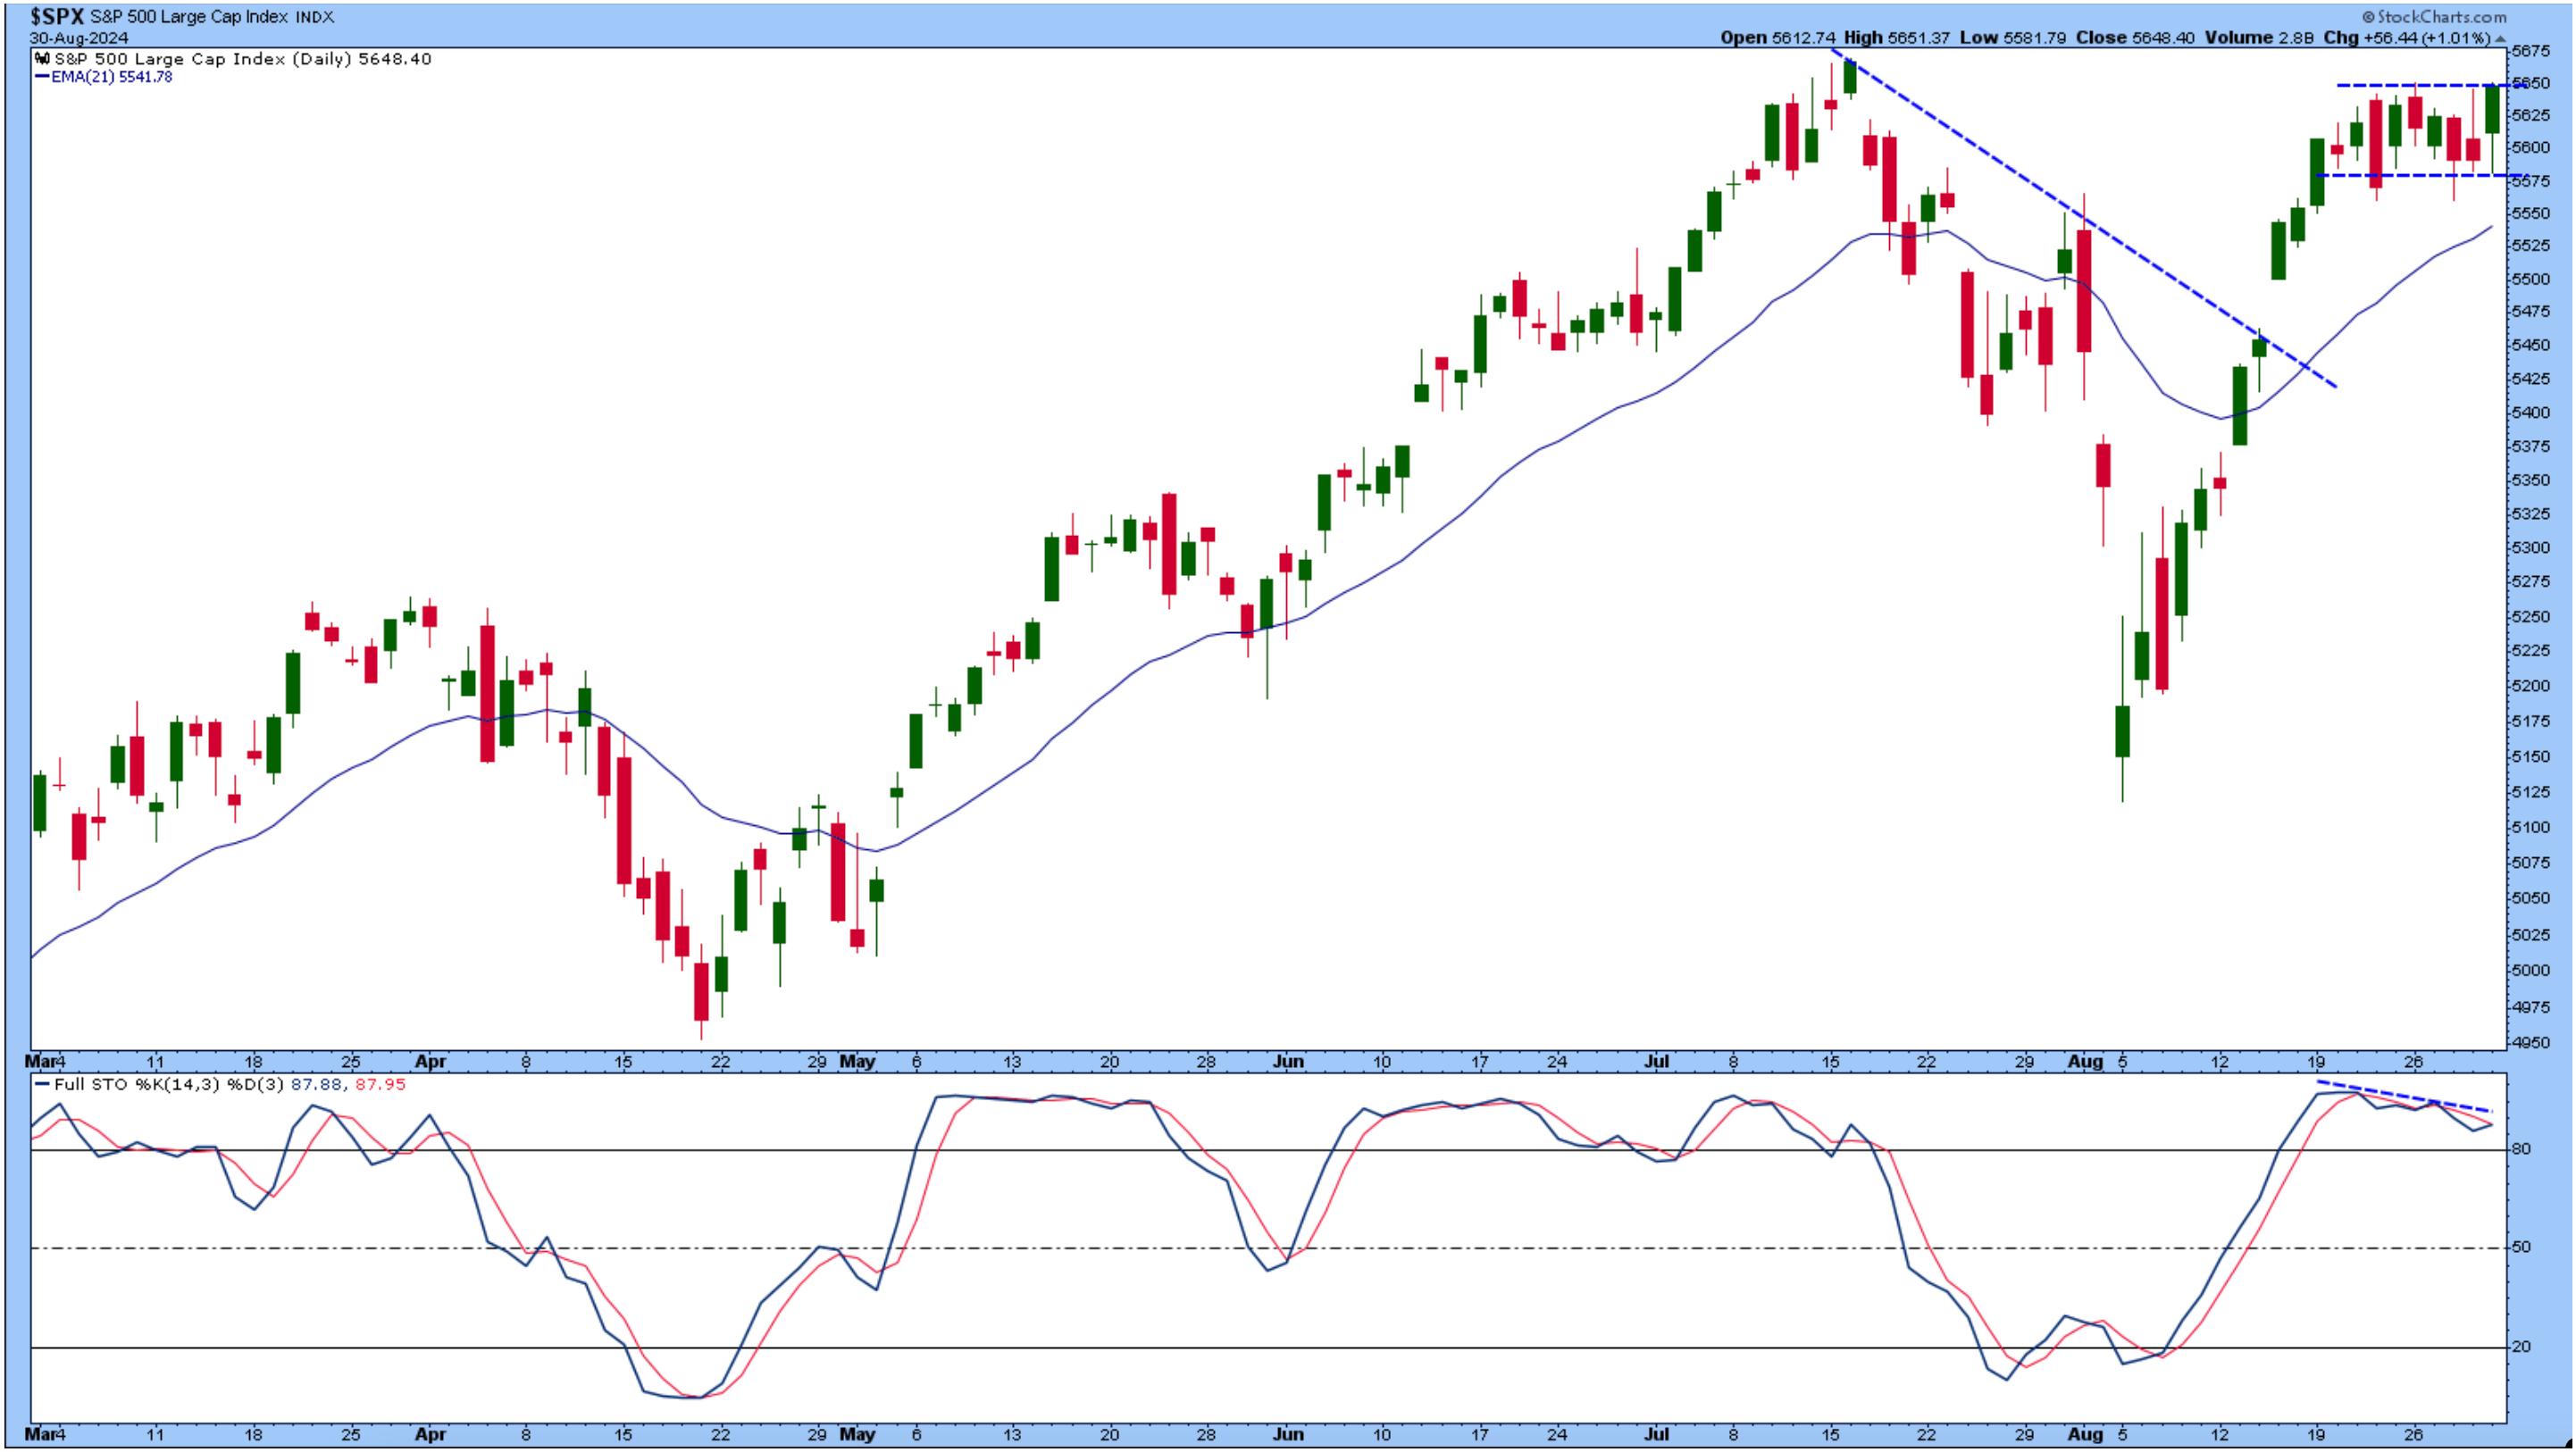
FIGURE 3. DAILY CHART OF S&P 500 INDEX. The index is trading sideways, close to its all-time high. The Stochastic Oscillator indicates that momentum is slowing slightly.Chart source: StockCharts.com. For educational purposes.
The stochastic oscillator is displaying some slowdown in momentum, as the oscillator shows a slight decline amidst the relatively flat movement in the S&P 500.
More interesting is the S&P 500 Equal Weighted Index ($SPXEW), which hit all-time highs. The relative strength index (RSI) and moving average convergence/divergence (MACD) indicate there could be room to rally. This suggests that investors are rotating out of the mega-cap stocks and into smaller-cap ones.
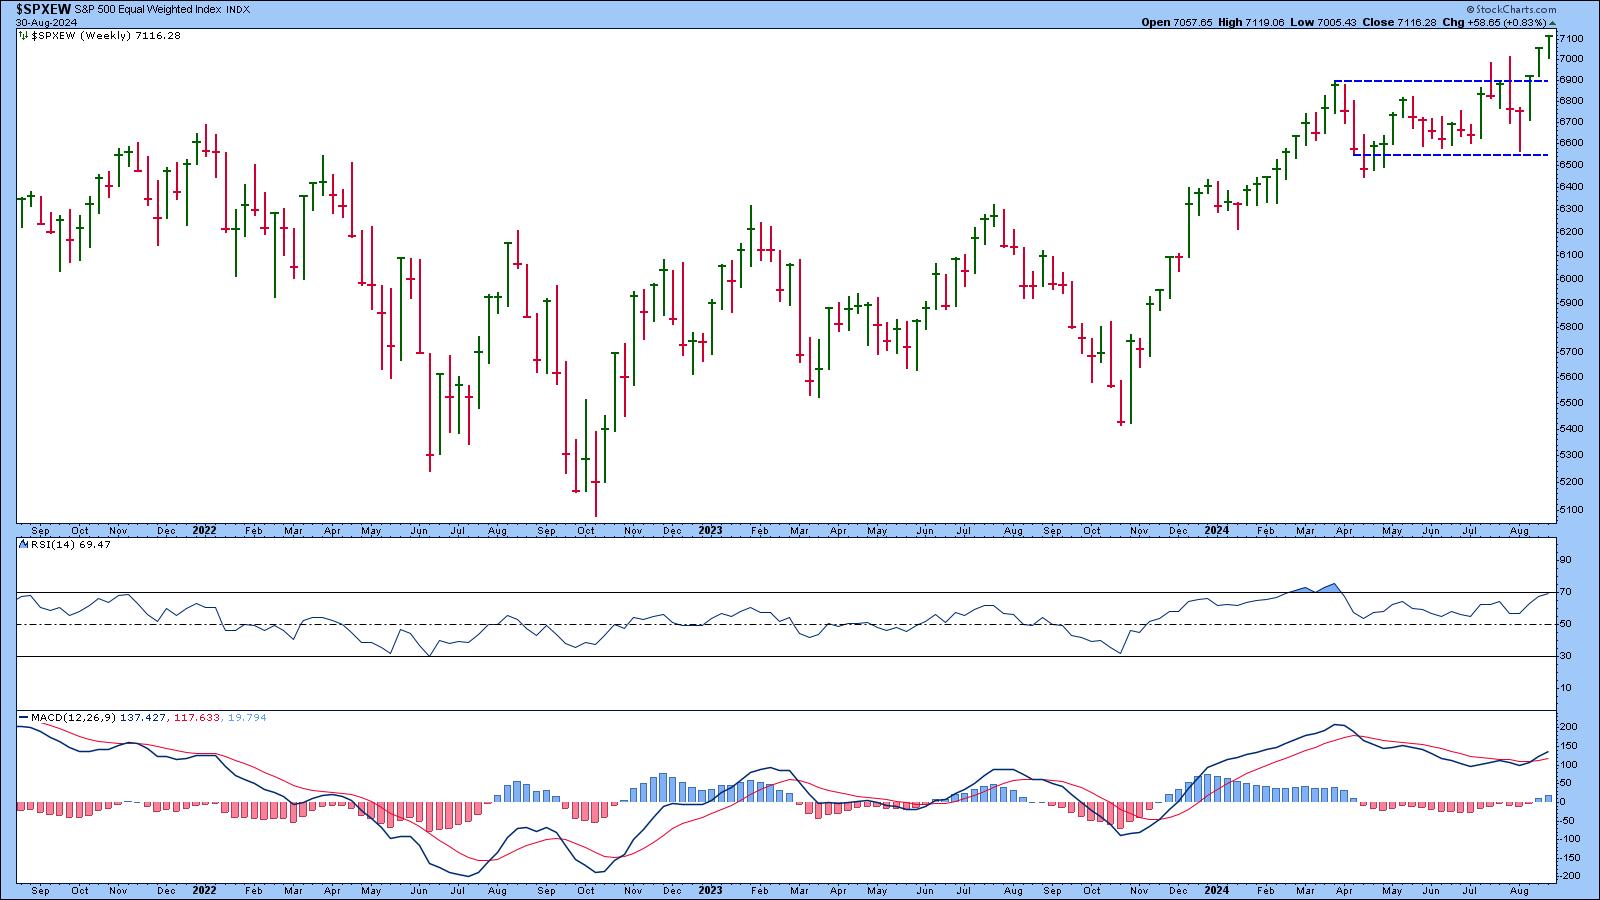
FIGURE 4. WEEKLY CHART OF S&P 500 EQUAL-WEIGHTED INDEX. The index is at a new all-time high. The RSI and MACD indicate there’s room for more upside move.Chart source: StockCharts.com. For educational purposes.
This begs the question of how mid-cap stocks perform. The daily chart of the S&P 500 Mid Cap Index ($MID) shows that mid-caps are trading sideways, but the index is close to its all-time highs, which happen to be close to the upper end of the trading range.
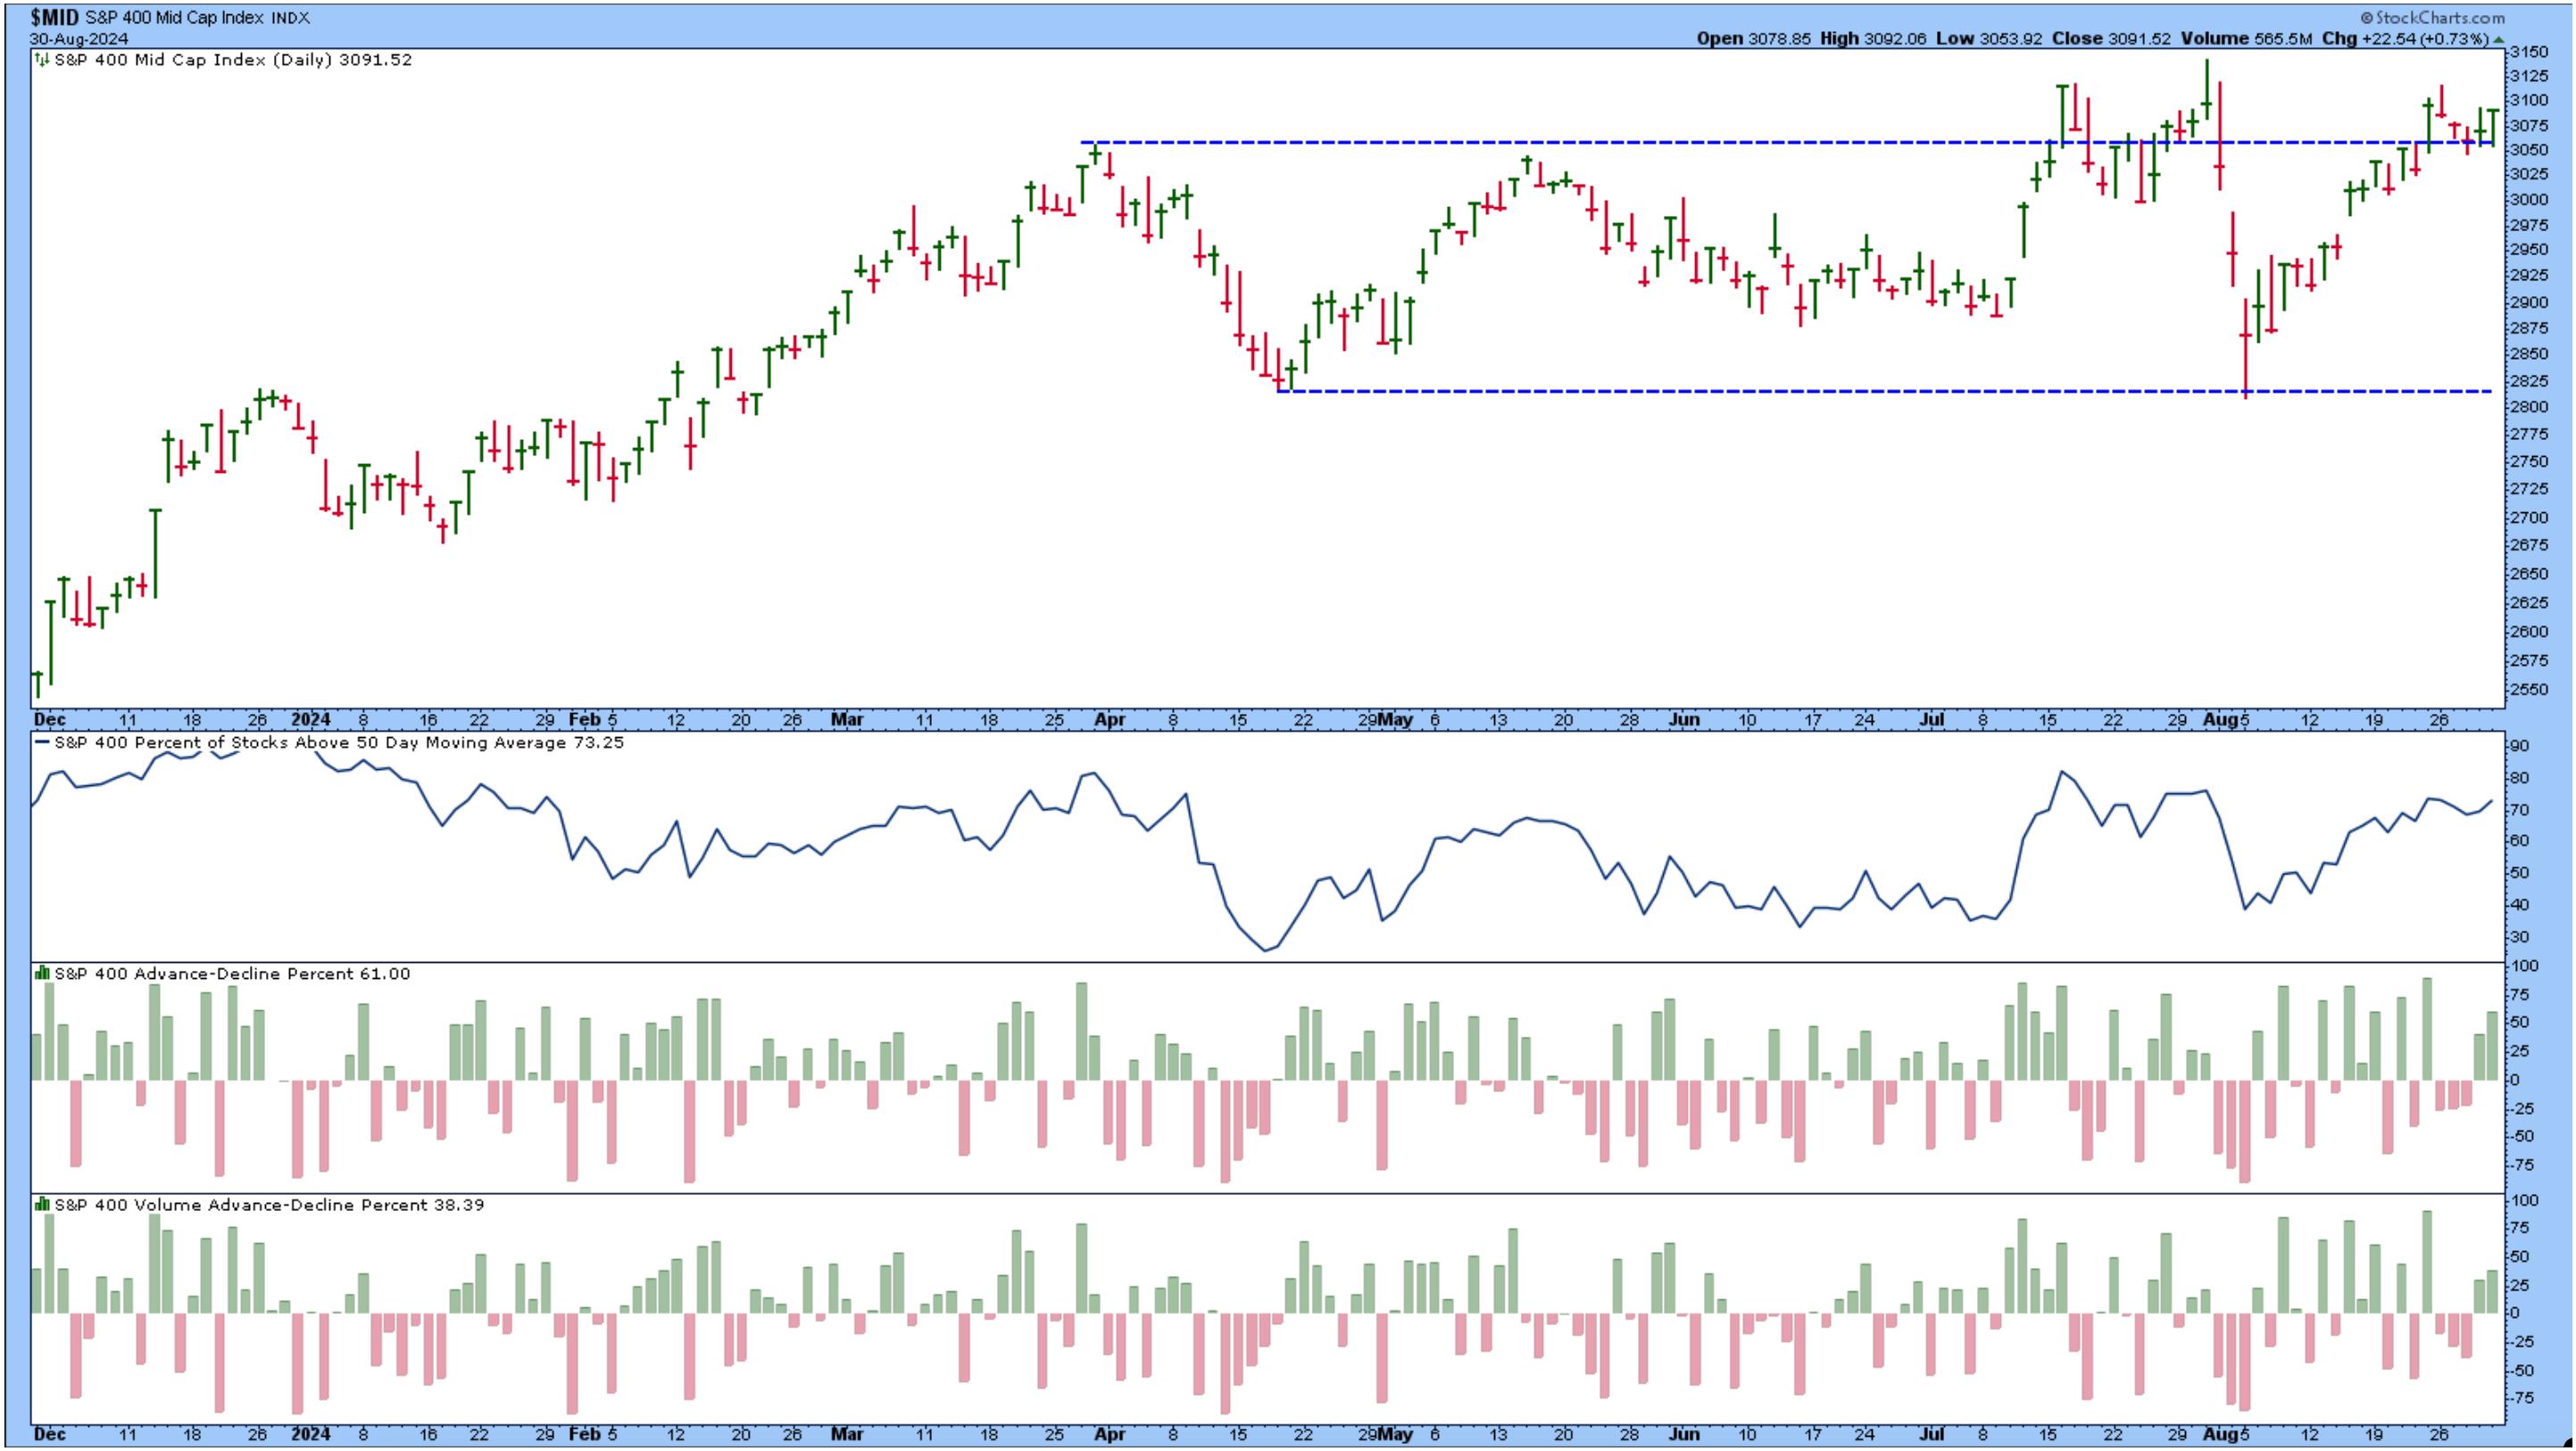
FIGURE 5. S&P 500 MID-CAP INDEX ($MID). The index is trading sideways but is trading close to the top of the range. Market breadth is also expanding, favoring bulls.Chart source: StockCharts.com. For educational purposes.
Market breadth in the mid-caps looks to be broadening, with 73.25% of mid-cap stocks trading above their 50-day simple moving average. The advancers also outnumber the decliners.
You’ll likely find a similar situation with the S&P 600 Small Cap Index ($SML).
 StockCharts Tip!
Click the above chart of $MID and change the symbol to $SML. Voila! You’ll get an updated chart specific to $SML.
So, which stocks in the mid and small-cap asset class should you focus on? This is when it helps to revert to the seasonality chart. Going through all the sector ETFs, Energy, and Utilities tend to be the leaders in September. Out of the two, the chart of Utilities Select Sector SPDR (XLU) shows a well-defined trend.
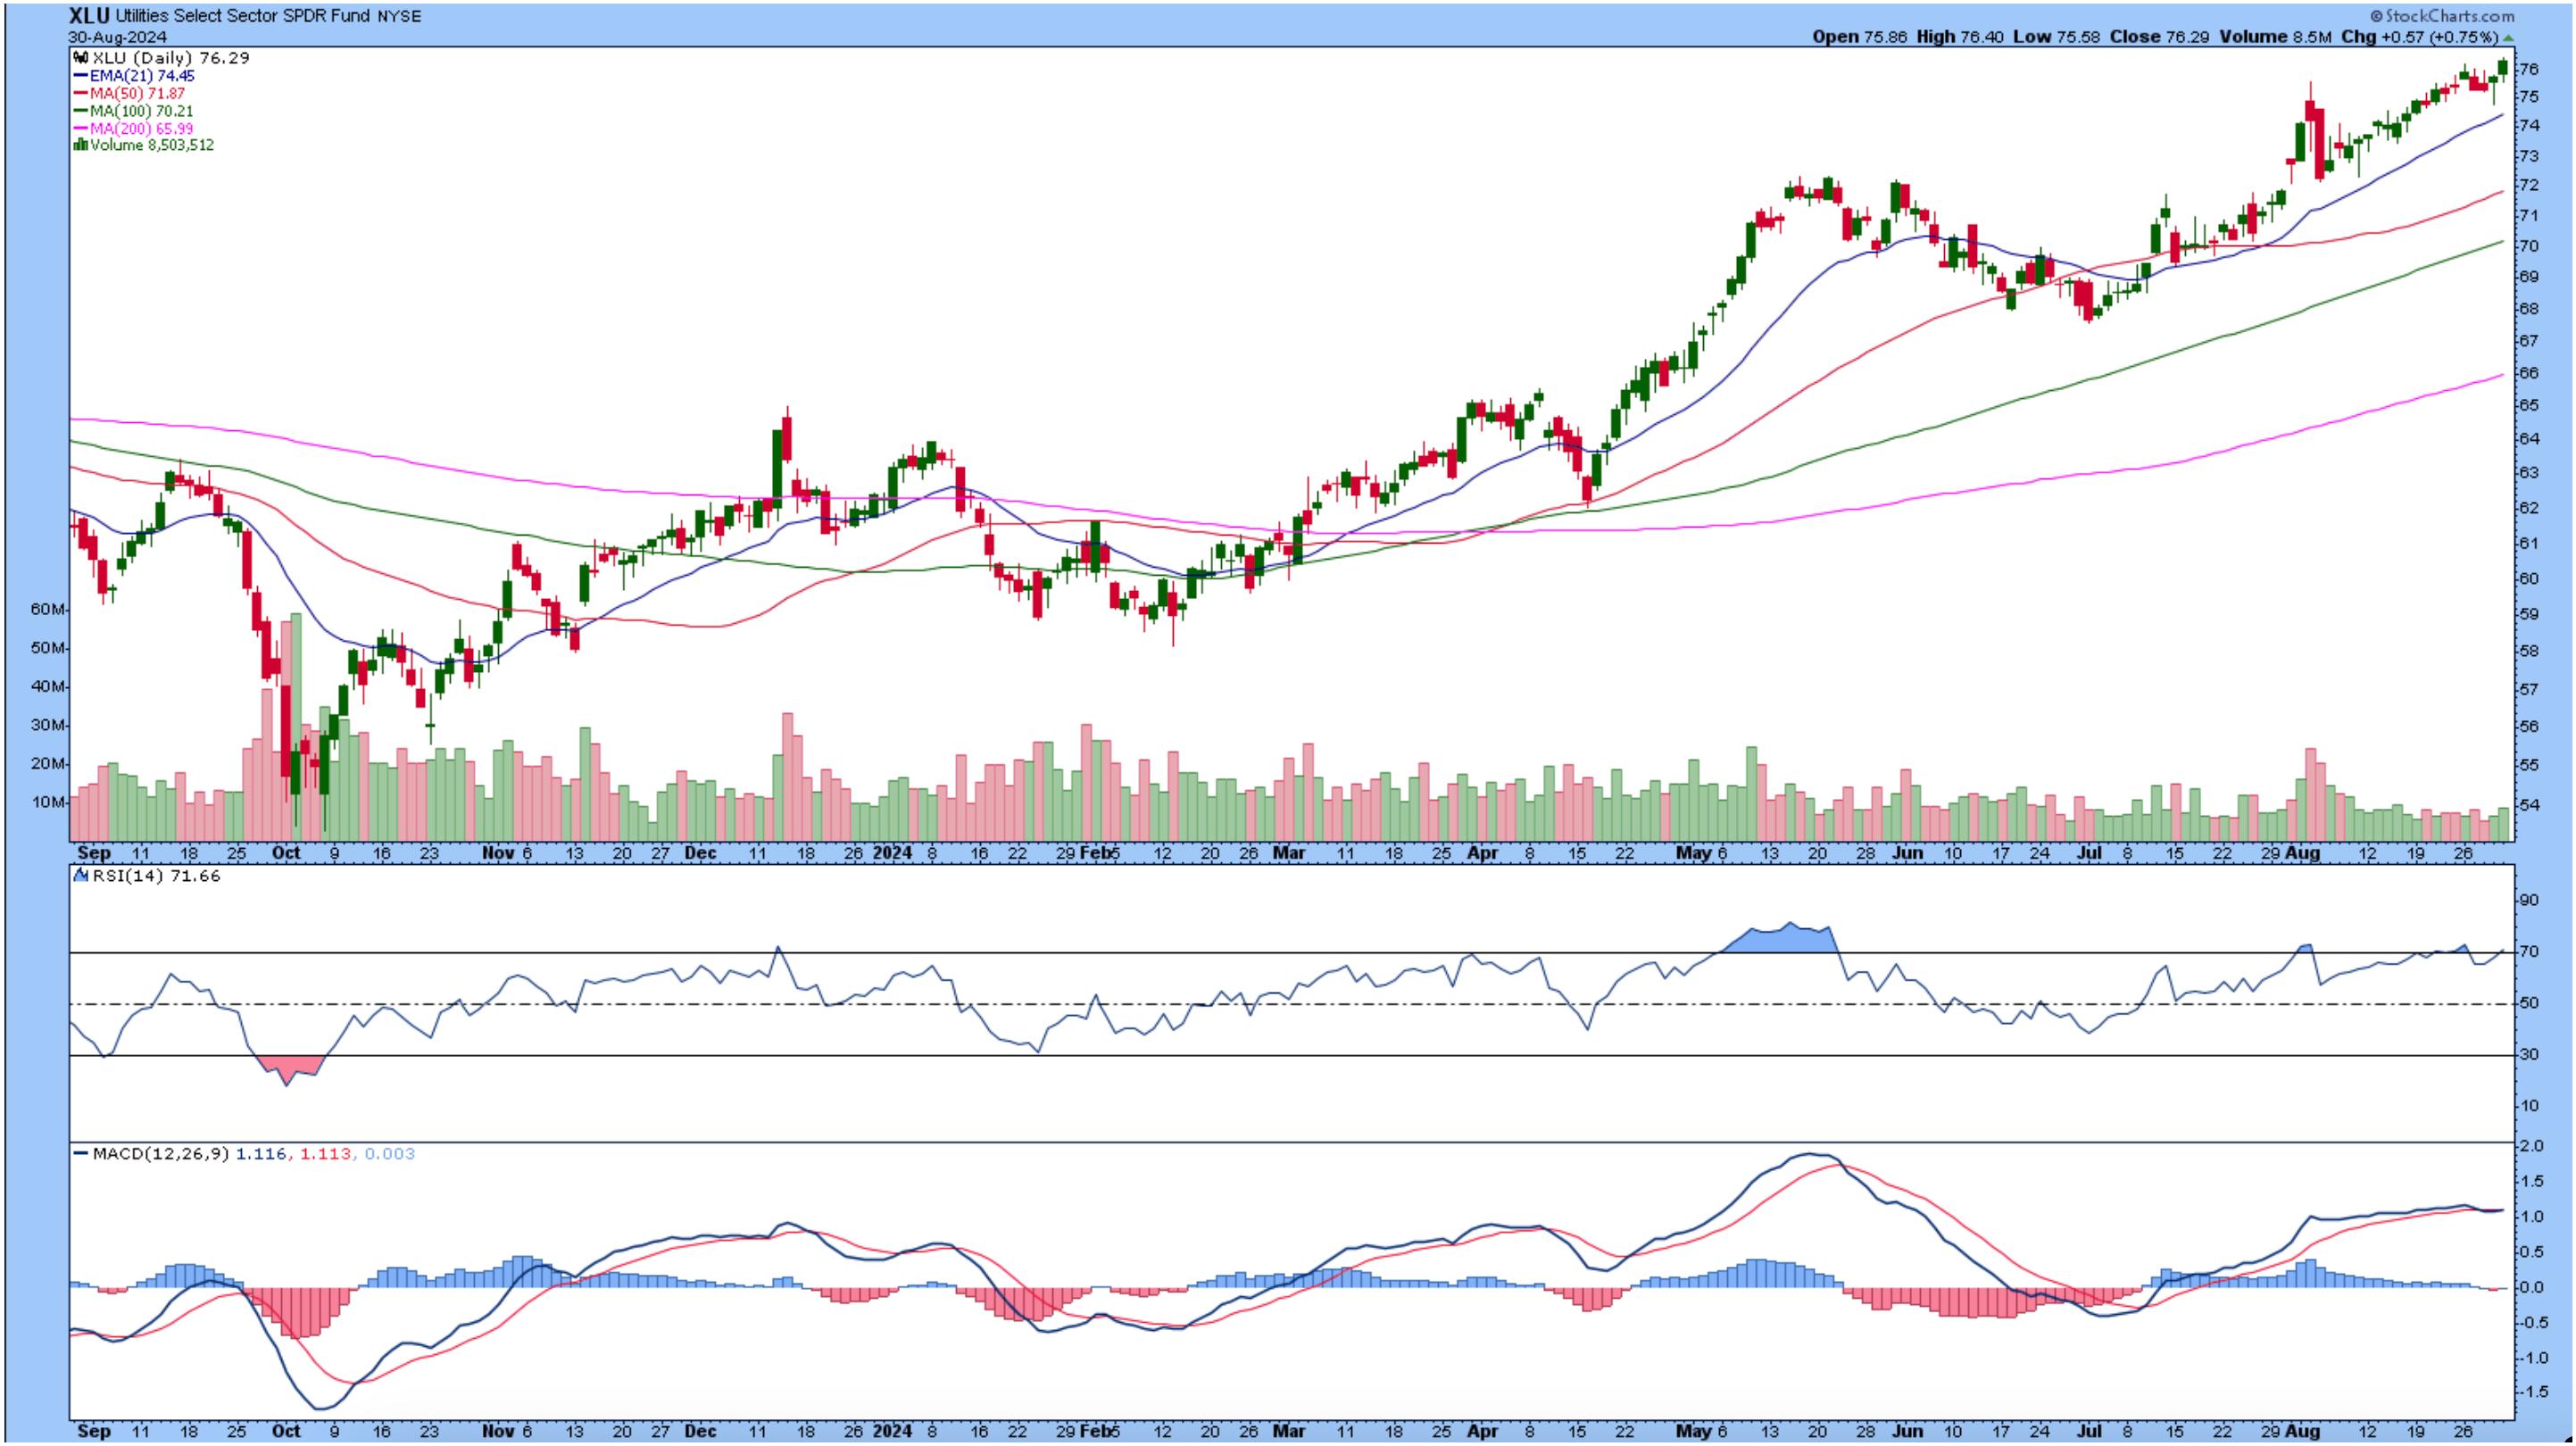
CHART 6. DAILY CHART OF XLU. Utilities have been in a sharp uptrend. The RSI and MACD indicate there’s room for more upside. Chart source: StockCharts.com. For educational purposes.
All moving averages overlaid on the chart are trending higher. The RSI and MACD also support the upward trend.
Closing Bell
So, while large-caps typically decline in September, it makes sense to consider investing a portion of your portfolio in mid and small-cap utility and energy stocks.
- On Your Dashboard, click the Sector Summary link (bottom right of Sector Summary panel).
- Select One Month from the Period dropdown menu.
- Click Utilities Sector Fund in the Name column.
- Click the name of the top-performing Industry within the sector.
- Sort the columns by Universe (U column) by clicking the up and down arrows to the right of U.
- Scroll down to the mid-cap stocks and analyze away.
Enjoy your Labor Day weekend, and be ready for market action to resume on Tuesday.
End-of-Week Wrap-Up
- S&P 500 closed up 0.24% for the week, at 5648.40, Dow Jones Industrial Average up 0.94% for the week at 41,563.08; Nasdaq Composite closed down 0.92% for the week at 17713.62
- $VIX down 5.42% for the week closing at 15
- Best performing sector for the week: Financials
- Worst performing sector for the week: Technology
- Top 5 Large Cap SCTR stocks: Insmed Inc. (INSM); FTAI Aviation Ltd. (FTAI); Carvana Co. (CVNA); SharkNinja, Inc. (SN); Tenet Healthcare Corp. (THC)
On the Radar Next Week
- Aug ISM Manufacturing PMI
- Aug S&P Global Services PMI
- Aug ISM Services PMI
- Aug Non Farm Payrolls
- Fed Beige Book
Disclaimer: This blog is for educational purposes only and should not be construed as financial advice. The ideas and strategies should never be used without first assessing your own personal and financial situation, or without consulting a financial professional.